How to create metrics from logs with Loki and Grafana

I have an application on a raspberrypi, whose only job is to check the temperature in the bedrooms and adjust the heating accordingly. It also produces logs like these:
{"level":"debug","type":"room_status","room_name":"Bedroom 1","measured_temp":18.4}
{"level":"debug","type":"room_status","room_name":"Bedroom 2","measured_temp":17.4}
{"level":"info","type":"room_request","message":"the room temperature is lower than expected, requesting heating","room_name":"Bedroom 2"}
For my monitoring setup, I've done the following steps:
- install Grafana
- install Loki
- register Loki as a Data Source in Grafana
- push logs to Loki using Promtail
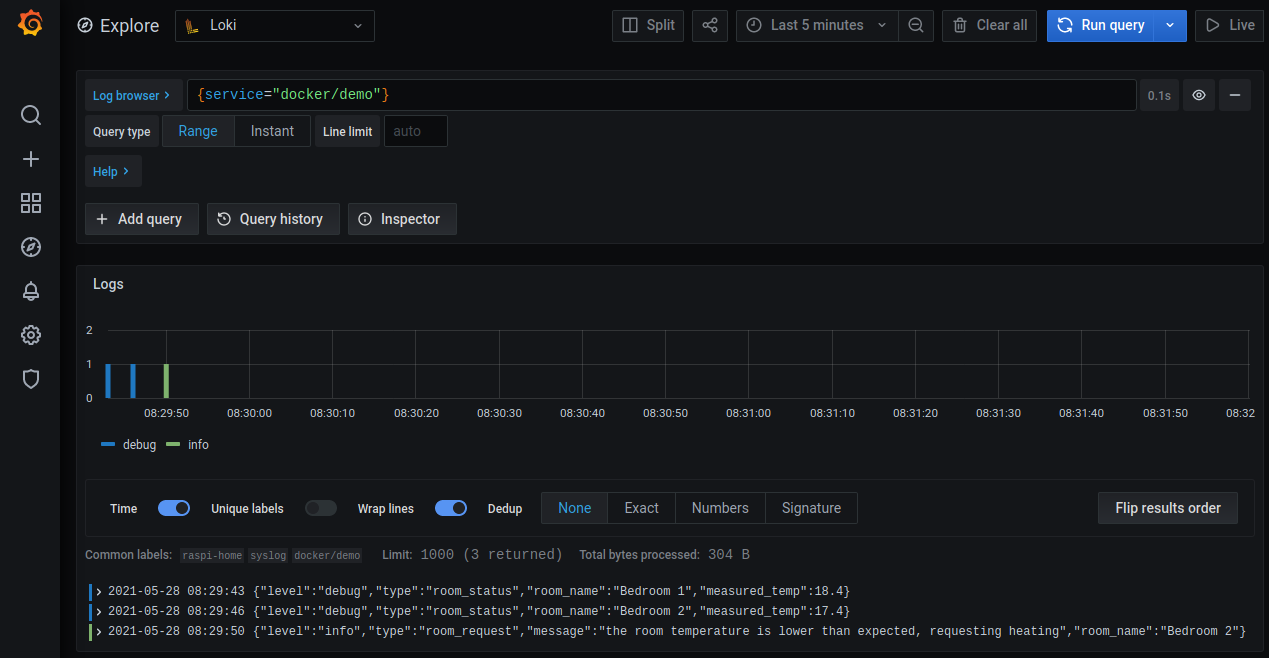
Logs are then accessible from Grafana:

And now the best part: With Loki & LogQL, I can write a simple query to extract metrics from the logs:
avg by (room_name) (avg_over_time({service="docker/demo"} |~ "room_status" | json | unwrap measured_temp [15m]))
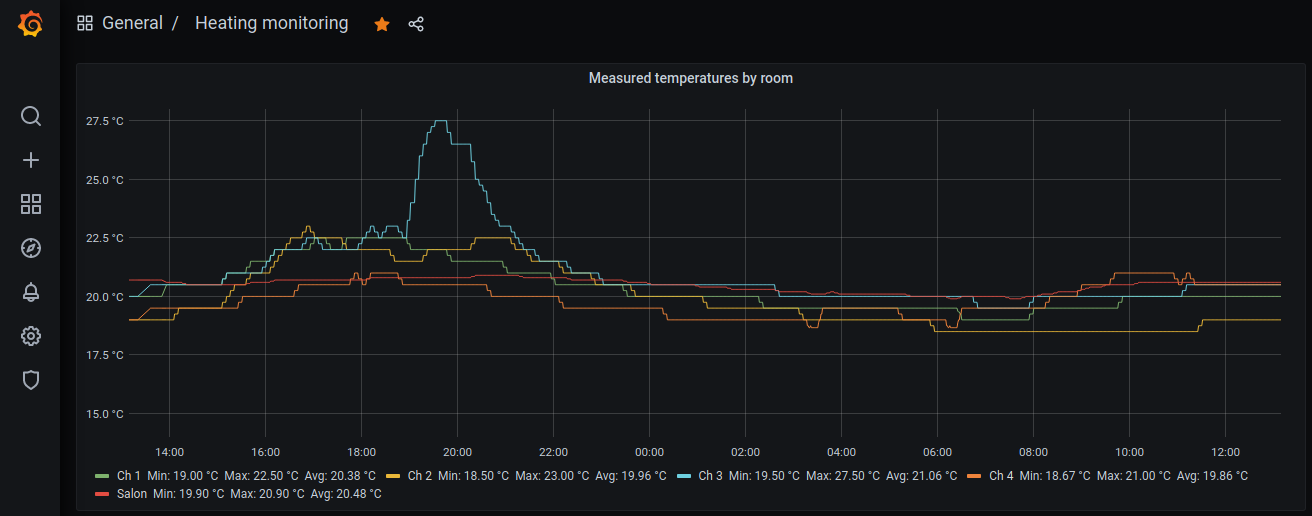
And the result, when using the query with more data in a Grafana panel:

note: I noticed that one of the bedrooms rise to 27.5°C around 8PM each day. It's not a bug, it's only because it's the exact time with the perfect angle where the sun reach and overheat the sensor.
That's all, I was expecting it to be more complicated but it was quit straightforward to setup.
From there, I am now able to easily create graphs and alerts for all my docker applications.
If you want to know more about the configuration and installation steps, I will go into more details in the next post.