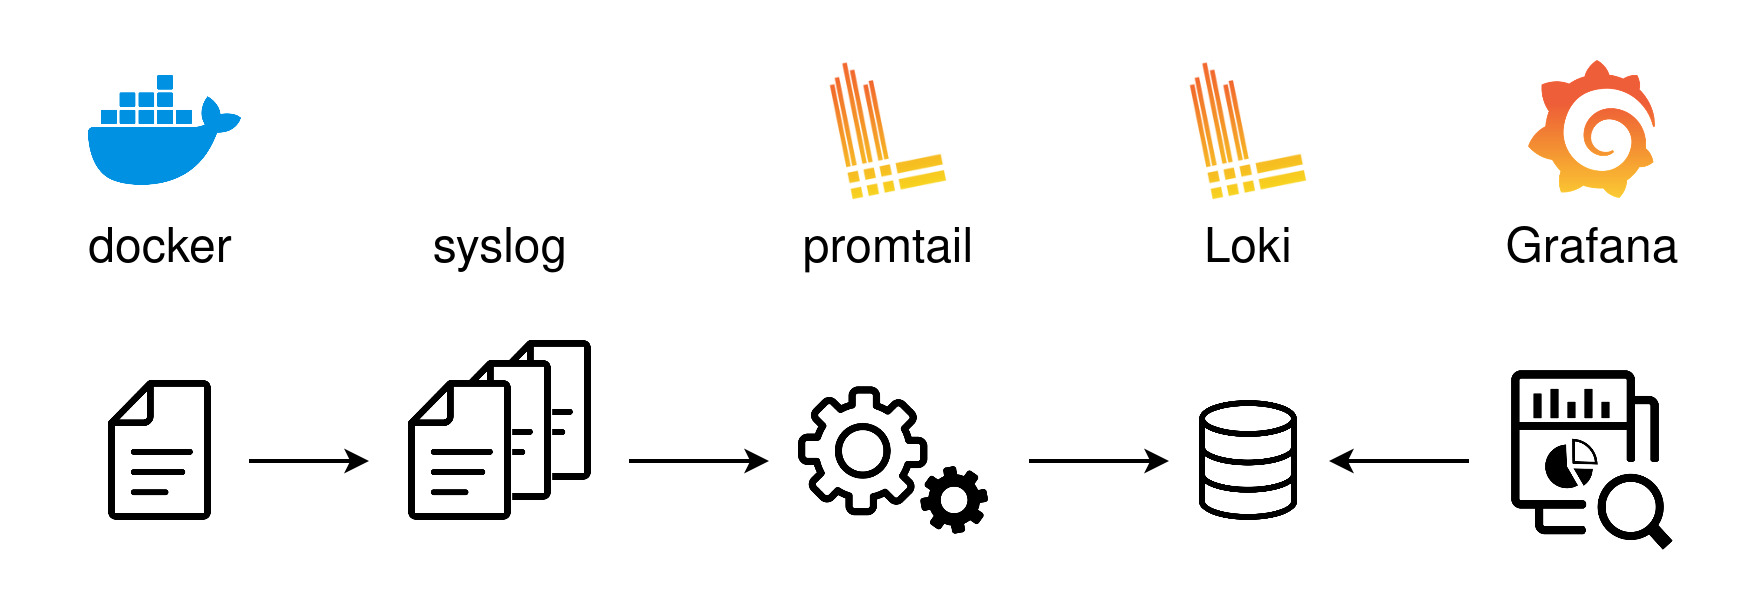
How to setup Grafana, Loki and promtail for monitoring docker

Step 1: Install Grafana
Grafana can easily be installed with a docker image. I had another linux server lying around, so I deployed it there.
Step 2: Install Loki
Loki is a Logging Data Source for Grafana, developed by the Grafana team itself, easy to use and a perfect fit
for my use case.
I've installed Loki v2.2.1 with docker, on the same server as Grafana, following the official documentation.
I've used the default config provided which was working out of the box for me.
Step 3: Register Loki as a Data Source in Grafana
Grafana has built-in support for Loki, it's straightforward to enable.
Step 4: Docker logs & syslog
Since my application on the raspberrypi is running with docker, the logs I need are sent to docker logs. Instead, I wanted all the logs from the docker containers to be stored in syslog.
Why syslog ?
The official recommended way of retrieving logs from docker with Loki is through a docker plugin. This does not fit the way I want to approach the observability of my applications (and maintenance of it).
An alternative would be to scrap files in/var/lib/docker/containers/*/*logbut these logs only contain the container id. It requires a trick to change the format of the logs for including the container name.
With the syslog solution, I do not change the behavior ofdocker logsand the docker configuration is not coupled to a specific scrapping tool. It's easier to swap between scrapping solutions (Logstash, Promtail, etc)
With docker dual logging capability, I can stream the logs to syslog while keeping them available in docker logs
at the same time.
I only have to update the docker daemon configuration:
/etc/docker/daemon.json:
{
    "log-driver": "syslog",
    "log-opts": {
        "tag": "docker/{{.Name}}"
    }
}
The Docker log tag option allows us to customize the service name which will appears in the logs.
Example from syslog:
May 22 14:13:59 hostname docker/demo[4606]: {"level":"debug","type":"room_status","room_name":"Bedroom 1","measured_temp":18.4}
May 22 14:13:59 hostname docker/demo[4606]: {"level":"debug","type":"room_status","room_name":"Bedroom 1","measured_temp":18.4}
May 22 14:13:59 hostname docker/demo[4606]: {"level":"info","type":"room_request","message":"the room temperature is lower than expected, requesting heating","room_name":"Bedroom 2"}
Step 5: From syslog to Loki with Promtail
Promtail is a simple binary scraping & sending logs. Since I'm running it on the raspberrypi (the client), I've
downloaded the promtail-linux-arm release from their github page.
Setup as a service with a simple systemd unit:
/etc/systemd/system/promtail.service:
[Unit]
Description=Promtail
Requires=network.target
After=syslog.target network.target

[Service]
Type=simple
ExecStart=/usr/local/bin/promtail-linux-arm --config.file /etc/promtail/config.yaml
User=root
Restart=on-failure

[Install]
WantedBy=multi-user.target
And the promtail config file:
/etc/promtail/config.yaml:
server:
  http_listen_port: 9080
  grpc_listen_port: 0

positions:
  filename: /tmp/positions.yaml

clients:
  - url: http://192.168.1.5:3100/loki/api/v1/push

scrape_configs:
- job_name: syslog
  static_configs:
  - targets:
      - localhost
    labels:
      __path__: /var/log/syslog
      job: syslog
  pipeline_stages:
  - regex:
      expression: (?P<syslog_datetime>(\S+\s+[0-9]{1,2}\s+[0-9]+:[0-9]+:[0-9]+))\s+(?P<syslog_hostname>(\S+))\s+(?P<syslog_service>(\S+))\[[0-9]+\]:\s+(?P<syslog_message>(.*))
  - timestamp:
      source: syslog_datetime
      format: Jan 02 15:04:05
      location: Europe/Paris
      action_on_failure: skip
  - output:
      source: syslog_message
  - labels:
      hostname: syslog_hostname
      service: syslog_service
note: 192.168.1.5:3100 should be replaced by the url of your loki instance.
With the configured regex in the pipeline stages, a line like this:
May 22 14:13:59 hostname docker/demo[4606]: {"level":"debug","type":"room_status","room_name":"Bedroom 1","measured_temp":18.4}
is approximately converted to this, before being stored in Loki:
{
    "timestamp": "Sat, 22 May 2021 12:13:59 GMT",
    "job": "syslog",
    "hostname": "hostname",
    "service": "docker/demo",
    "message": "{\"level\":\"debug\",\"type\":\"room_status\", ...}"
}
tip: For performance reasons, Loki recommends to avoid creating too many labels. It will slow down the storage. Instead, data can be extracted from the fields at access-time with LogQL.